

The Activity page is available to backend administrators who have been granted at least one core
Curator permission, for example Manage Curator settings. See
Backend Administrator Permissions
for the full list of permissions and what each one controls.
To pull this data into your own reporting instead of reading it here, see
Retrieving Usage Data.
Filtering the view
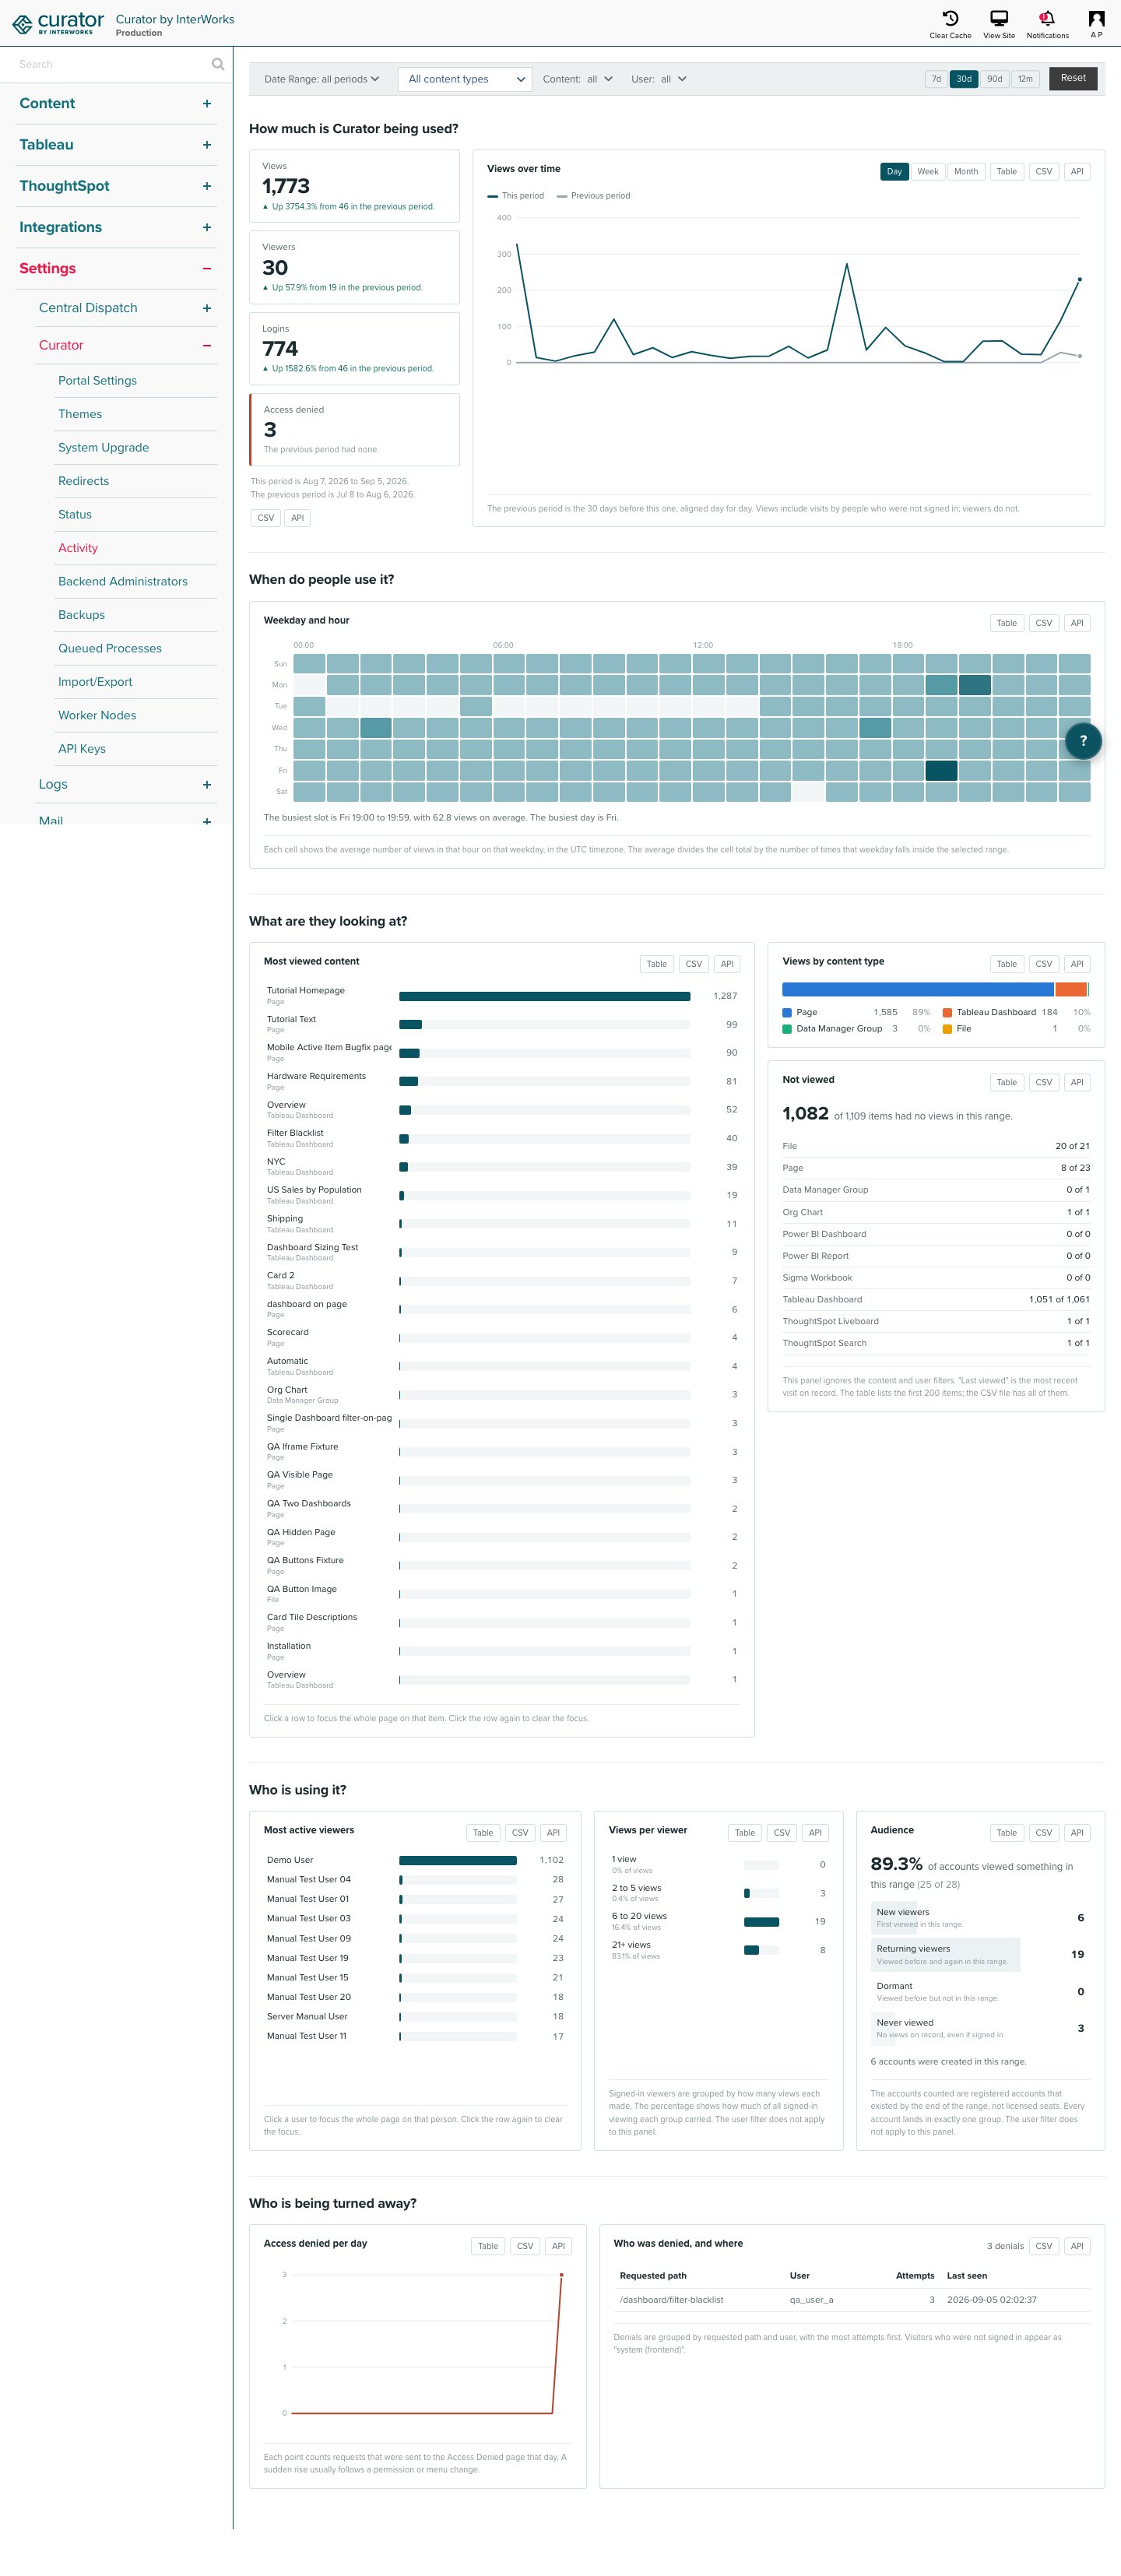
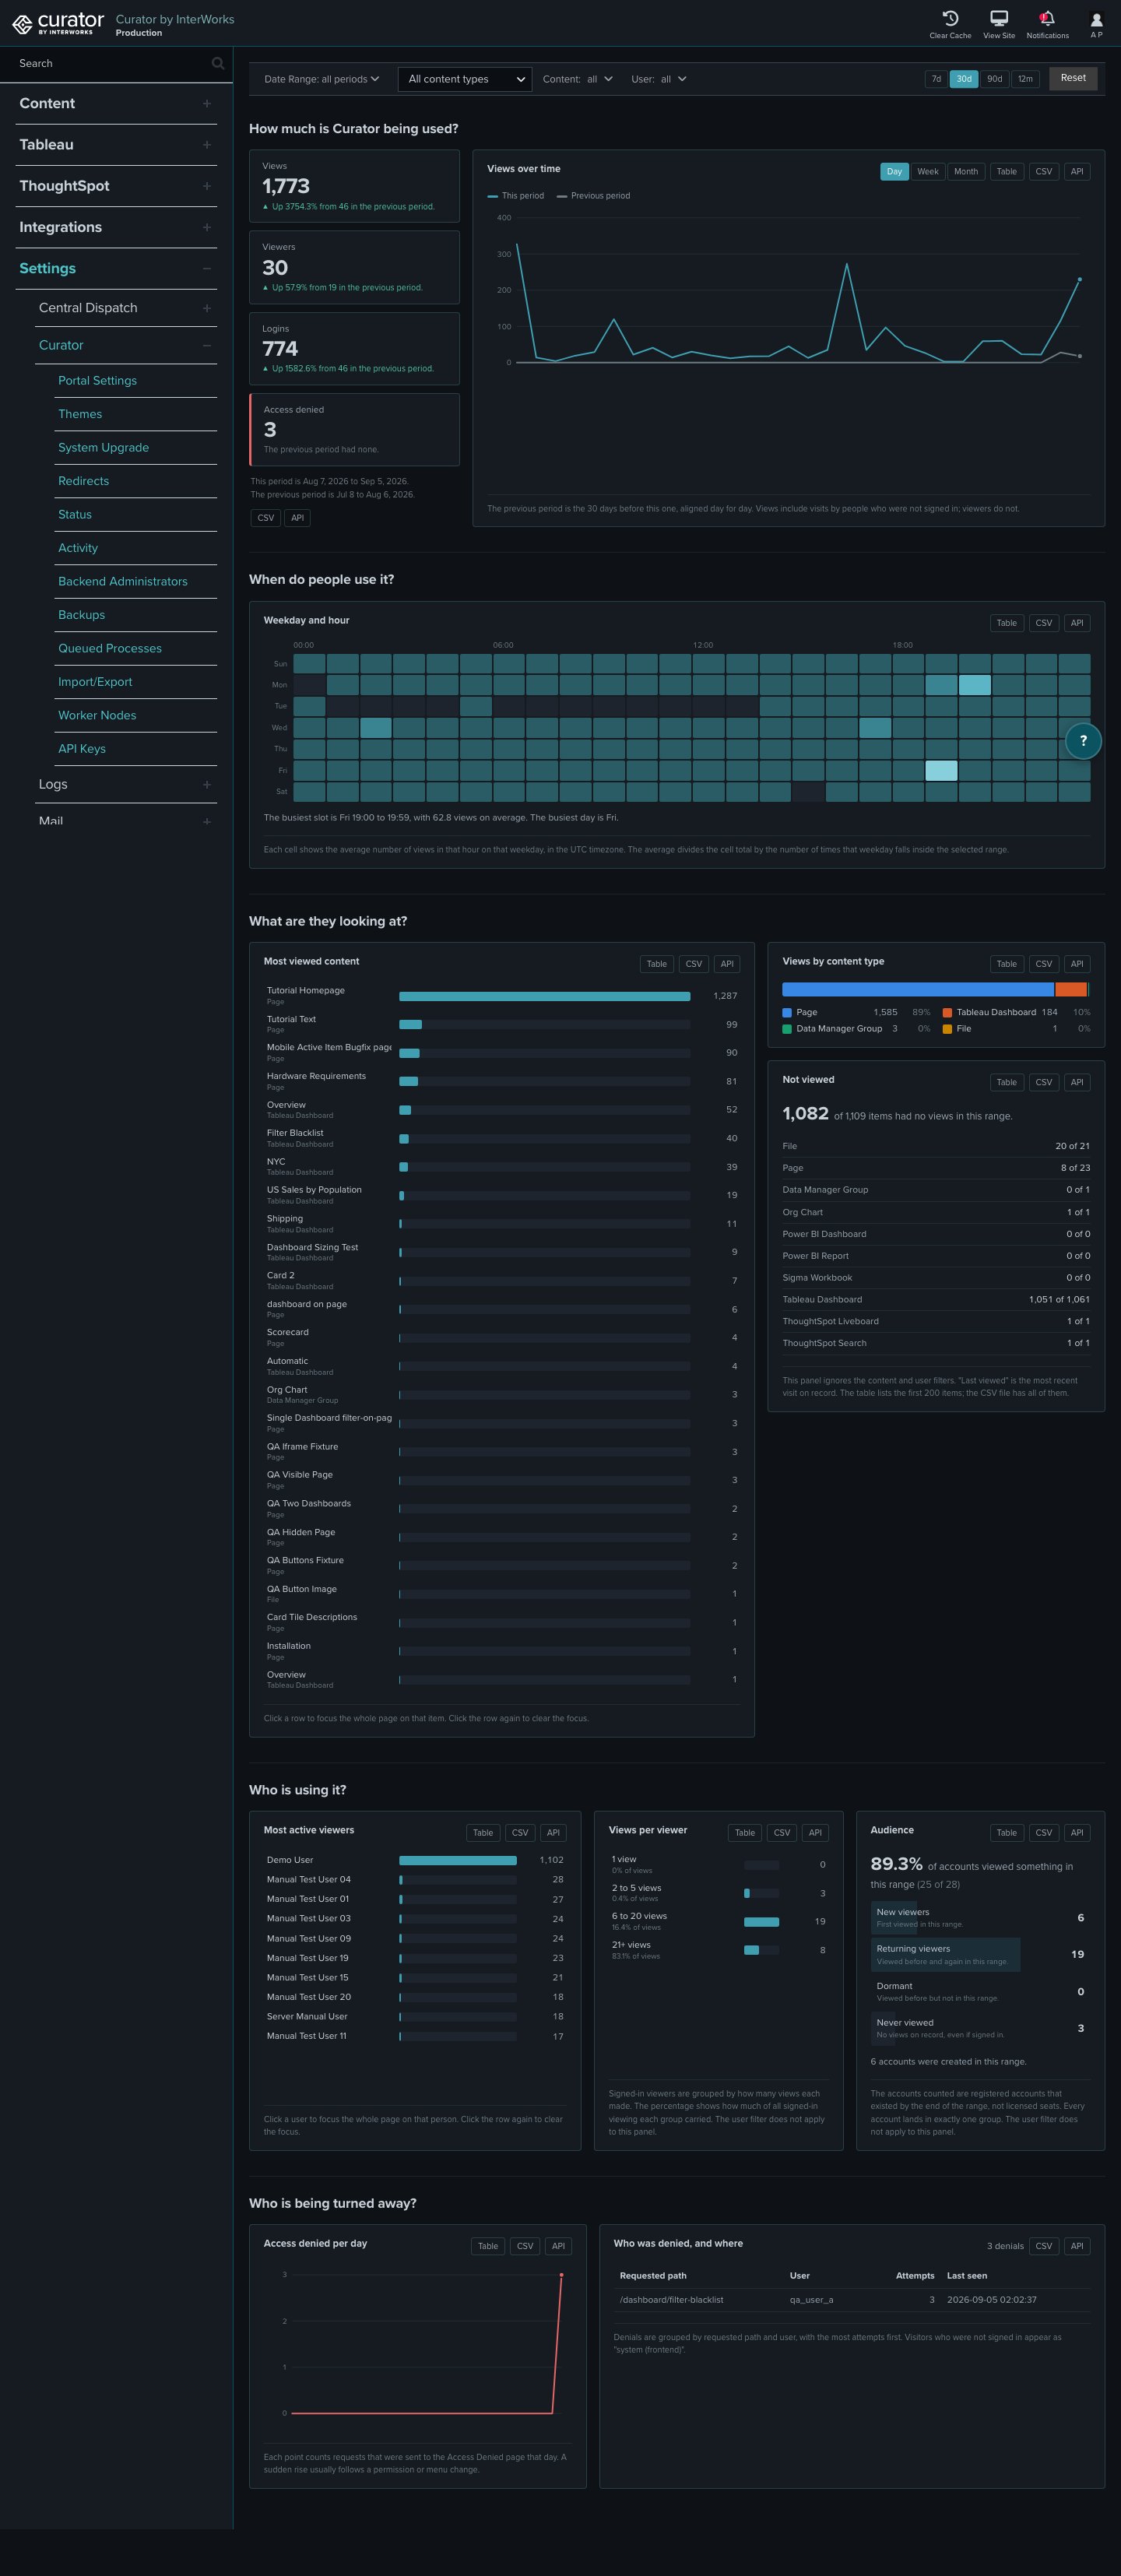
The filter bar narrows every panel to a time period, a content type, a single content item, or a single user. All panels update as soon as a filter changes.- Date Range selects a start and end date. When no range is set, the page shows the last 30 days.
- 7d / 30d / 90d / 12m are quick ranges that end today.
- Content Type narrows the page to one platform, for example Tableau dashboards or Pages.
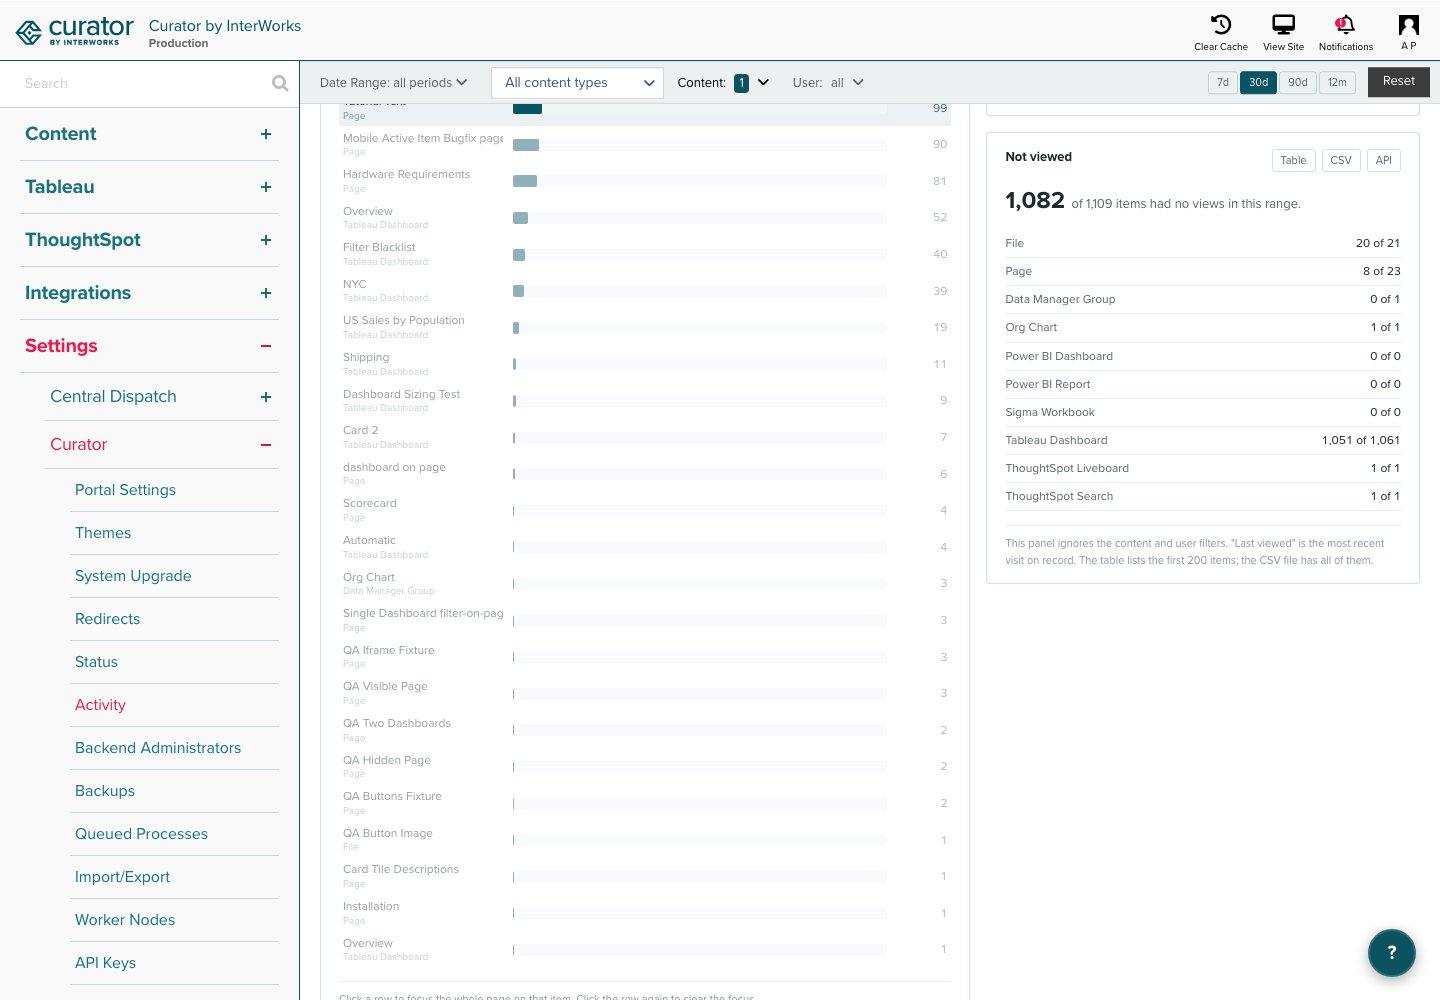
- Content narrows the page to one item. The list holds the 100 most viewed items.
- User narrows the page to one person.
Reading, downloading, and fetching a panel
Every panel has three buttons in its header:- Table shows the same numbers as a plain table. Click Table again to return to the chart.
- CSV downloads the table as a CSV file with the current filters applied. The link can be bookmarked or shared with another administrator, who must be signed in to the backend to use the link.
- API copies the panel’s API URL to your clipboard with the current filters applied. Add your API key as
the
apikeyparameter before you use the URL. See Activity API for the parameters and the response format.
How much is Curator being used?
Four headline figures compare the selected range with the period of the same length that came right before it. For a 30-day range, the comparison is the 30 days before that.- Views counts every content view, including views by visitors who were not signed in.
- Viewers counts distinct signed-in users who viewed something.
- Logins counts sign-ins from the usage log.
- Access denied counts requests that were sent to the Access Denied page. For this figure, up is bad, and the color reflects that.
When do people use it?
A weekday by hour heatmap shows the average number of views in each hour slot, in the timezone Curator is configured to use. Each cell divides its total by the number of times that weekday falls inside the selected range, so a range that holds two Mondays and one Sunday does not make Monday look twice as busy. A sentence under the grid names the busiest slot and the busiest day. Use this panel to choose maintenance windows and extract refresh times.What are they looking at?
- Most viewed content lists the top 25 items. Click a row to focus the whole page on that item, and click the row again to clear the focus.
- Views by content type shows how views split across platforms, with the count and share for each.
- Not viewed counts the items of each content type that received no views in the selected range, and lists them in its table with the last time each was ever viewed. Use the panel to find content to retire. This panel ignores the content and user filters, because “not viewed” only makes sense across everything.
Who is using it?
- Most active viewers lists the top 10 signed-in users. Click a row to focus the page on that user.
- Views per viewer groups signed-in viewers by how many views they made (1, 2 to 5, 6 to 20, 21 or more) and shows what share of all signed-in viewing each group carried, so you can tell whether usage is broad or carried by a few power users. The user filter does not apply to this panel.
-
Audience places every account that existed by the end of the range into exactly one group:
- New viewers made their first ever view in the range.
- Returning viewers viewed before the range and again inside the range.
- Dormant viewed before the range but not inside the range.
- Never viewed have no views on record, including accounts that only signed in.
Who is being turned away?
- Access denied per day charts denials over the range. A sudden rise usually follows a permission or menu change.
- Who was denied, and where groups denials by requested path and user, most attempts first, with the last time each pair was seen. Visitors who were not signed in appear as “system (frontend)”.
What are they searching for?
This section reports on Beta Search. It stays empty until you turn on Search Analytics (Portal Settings, Features tab). Until then it shows a message naming the setting. See Search Analytics for what is stored.- Top search terms lists the most searched terms with the number of searches, the click-through rate (the share of searches that ended in a click on a result), and the average number of results shown. A term that is searched often but rarely clicked usually means the results are not what people expected. Add keywords to the content they are looking for.
- Zero-result terms lists the terms that showed no results, by number of searches. These are searches that found nothing, so add content for them, or add the term as a keyword to existing content.