> ## Documentation Index
> Fetch the complete documentation index at: https://docs.curator.interworks.com/llms.txt
> Use this file to discover all available pages before exploring further.
# Power BI Report
> Adding Power BI reports to Pages.
export const BackendNavPath = ({levelOne, levelTwo, levelThree, tab, section}) => {
const levels = [levelOne, levelTwo, levelThree].filter(Boolean);
const lastLevel = levels.length ? levels[levels.length - 1] : '';
return
In the backend of Curator using the left-hand navigation,
navigate to the
{levelOne && {" " + levelOne}}
{levelOne && levelTwo && " > "}
{levelTwo && {levelTwo}}
{levelTwo && levelThree && " > "}
{levelThree && {levelThree}} page.
{(tab || section) && <>
{" "}On the {lastLevel} page
{tab && <> click the {tab} tab}
{tab && section && " and"}
{section && <> expand the {section} section}.
}
;
};
When embedding Power BI reports in Curator, you have the option to add them directly to pages for a more dynamic
layout. This allows you to create rich, interactive pages that incorporate Power BI reports alongside other content.
## Adding A Power BI Report to Pages
Once a [Power BI Report has been added to Curator](/embedding_using_analytics/power_bi_reports/adding_a_power_bi_report)
follow the steps below to add it to a page:
1.
2. Find the page you'd like to add your Power BI Report to, or click the "+ New Page" button.
3. Select the element you'd like to make a Power BI Report, or click the plus (+) icon to add a new blank element.
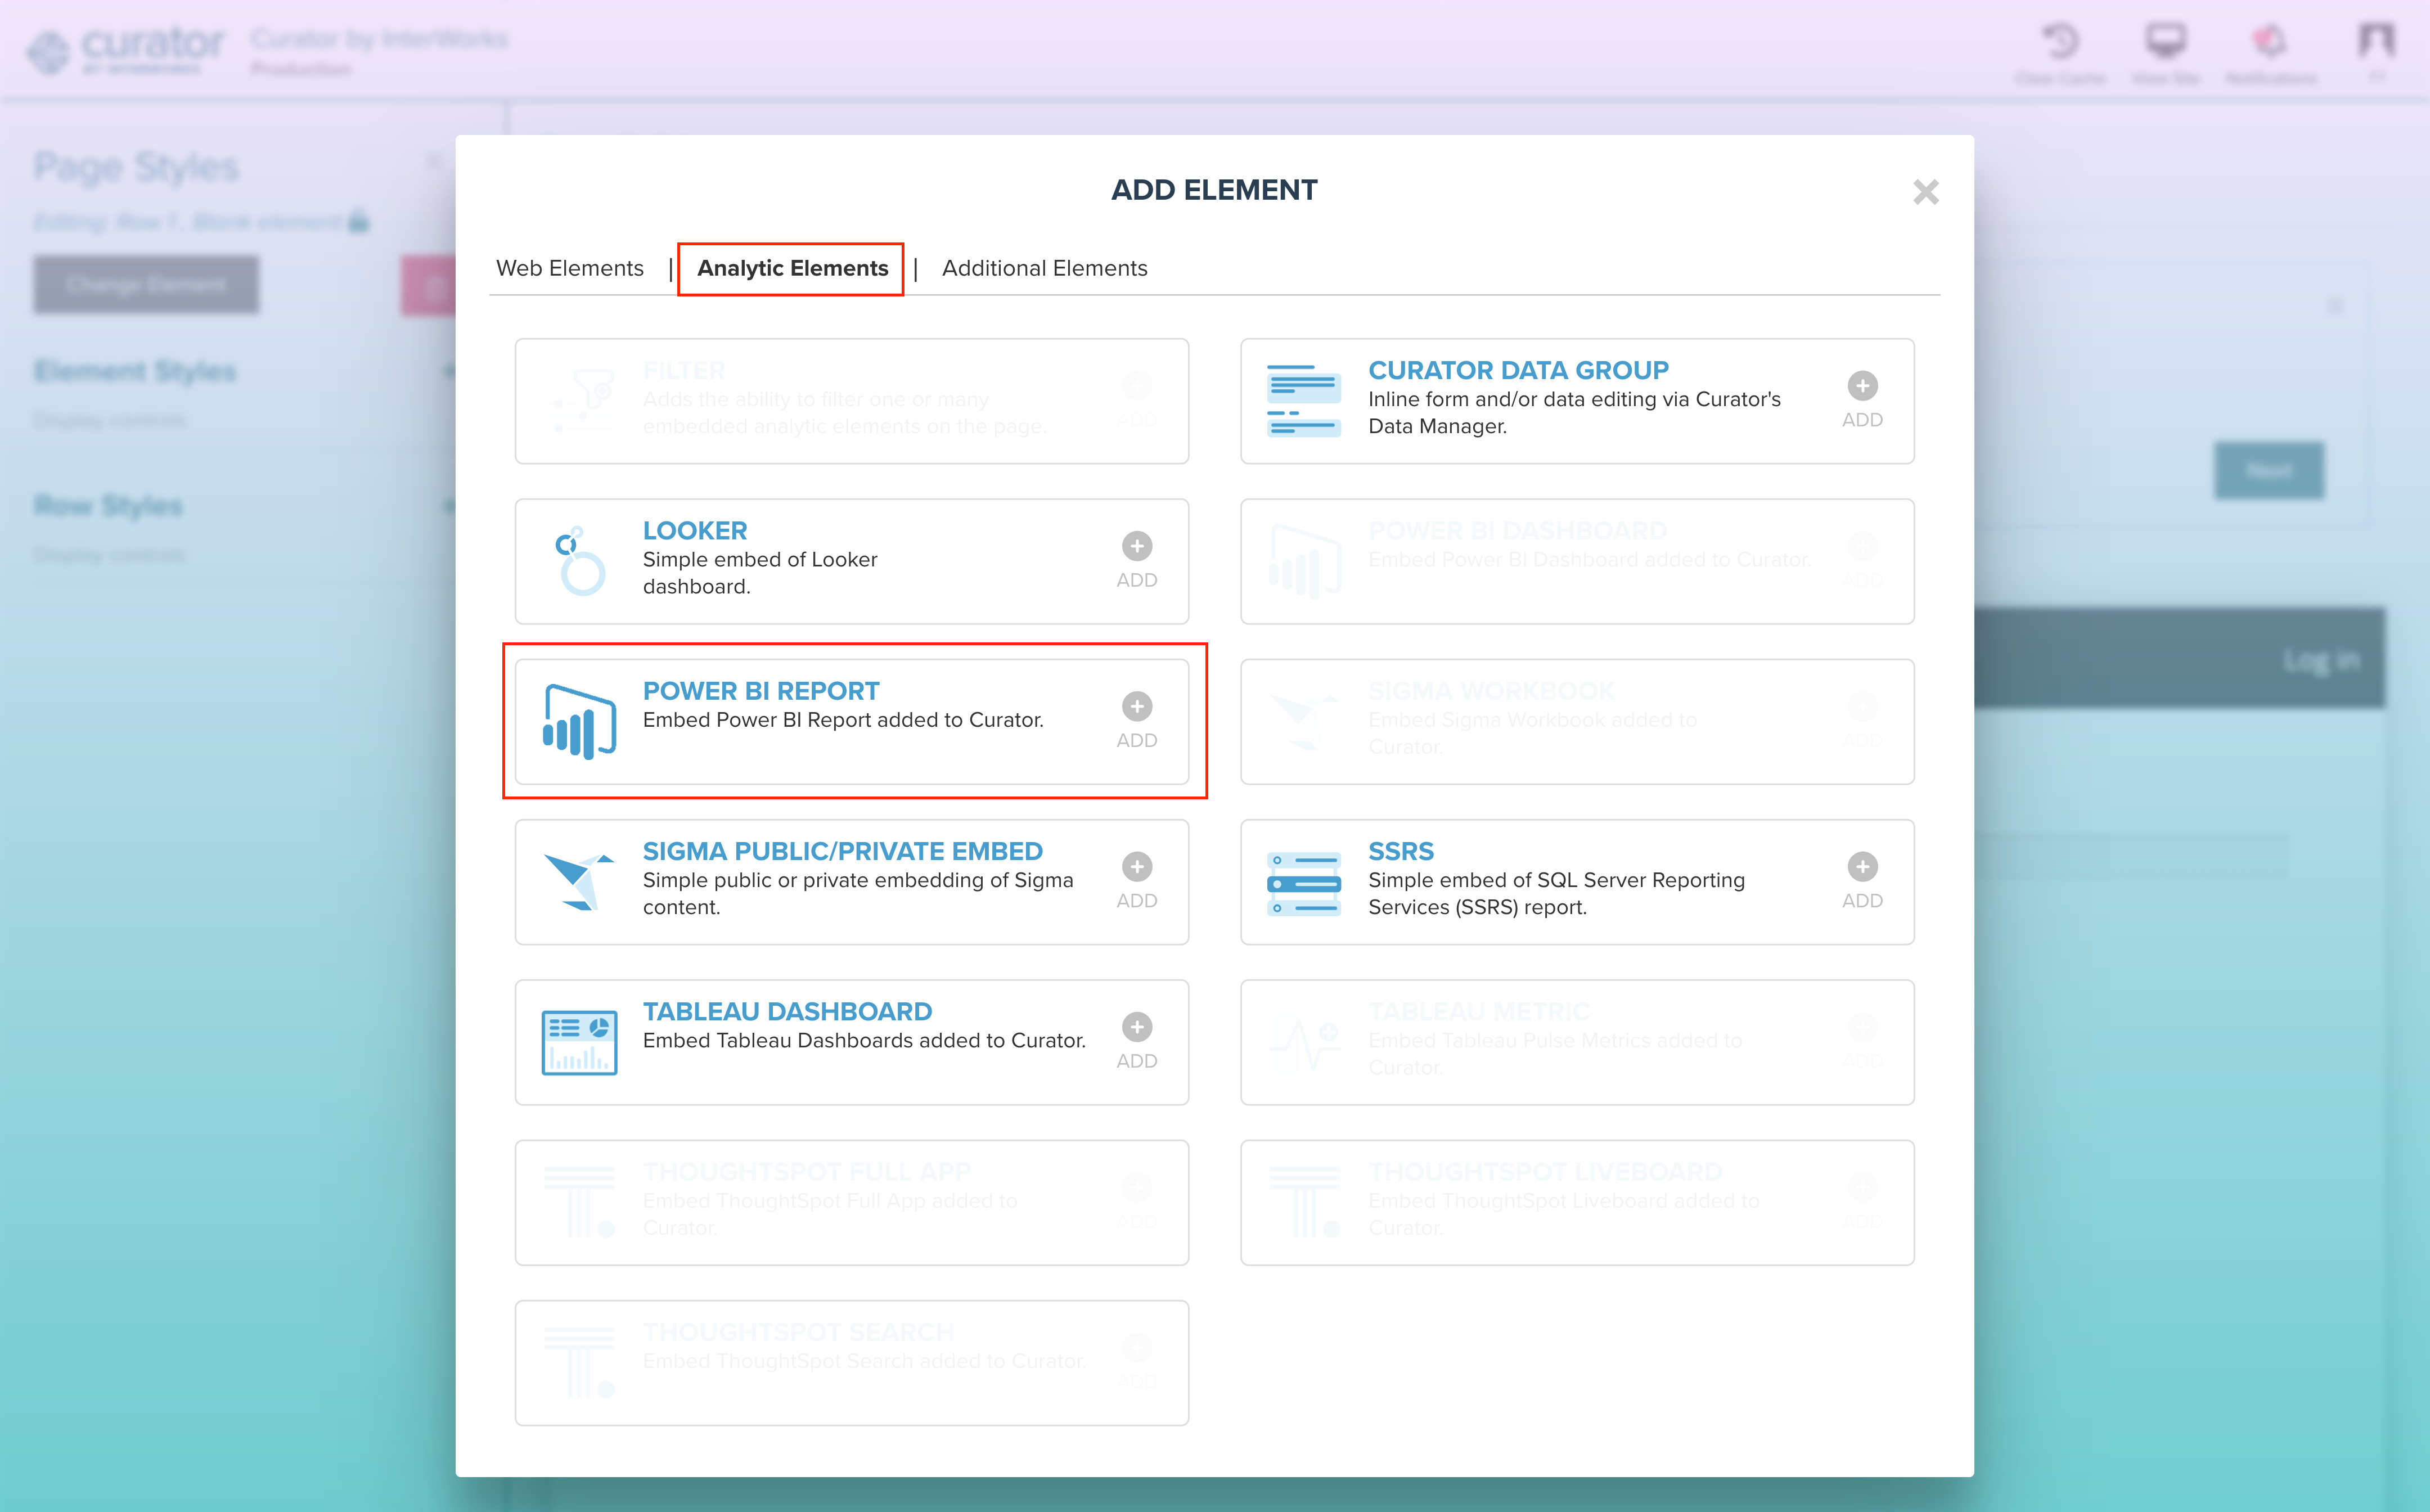
4. In the "Add Element" pop-up, click on the **Analytic Elements** tab at the top and select the **Power BI Report**
option.
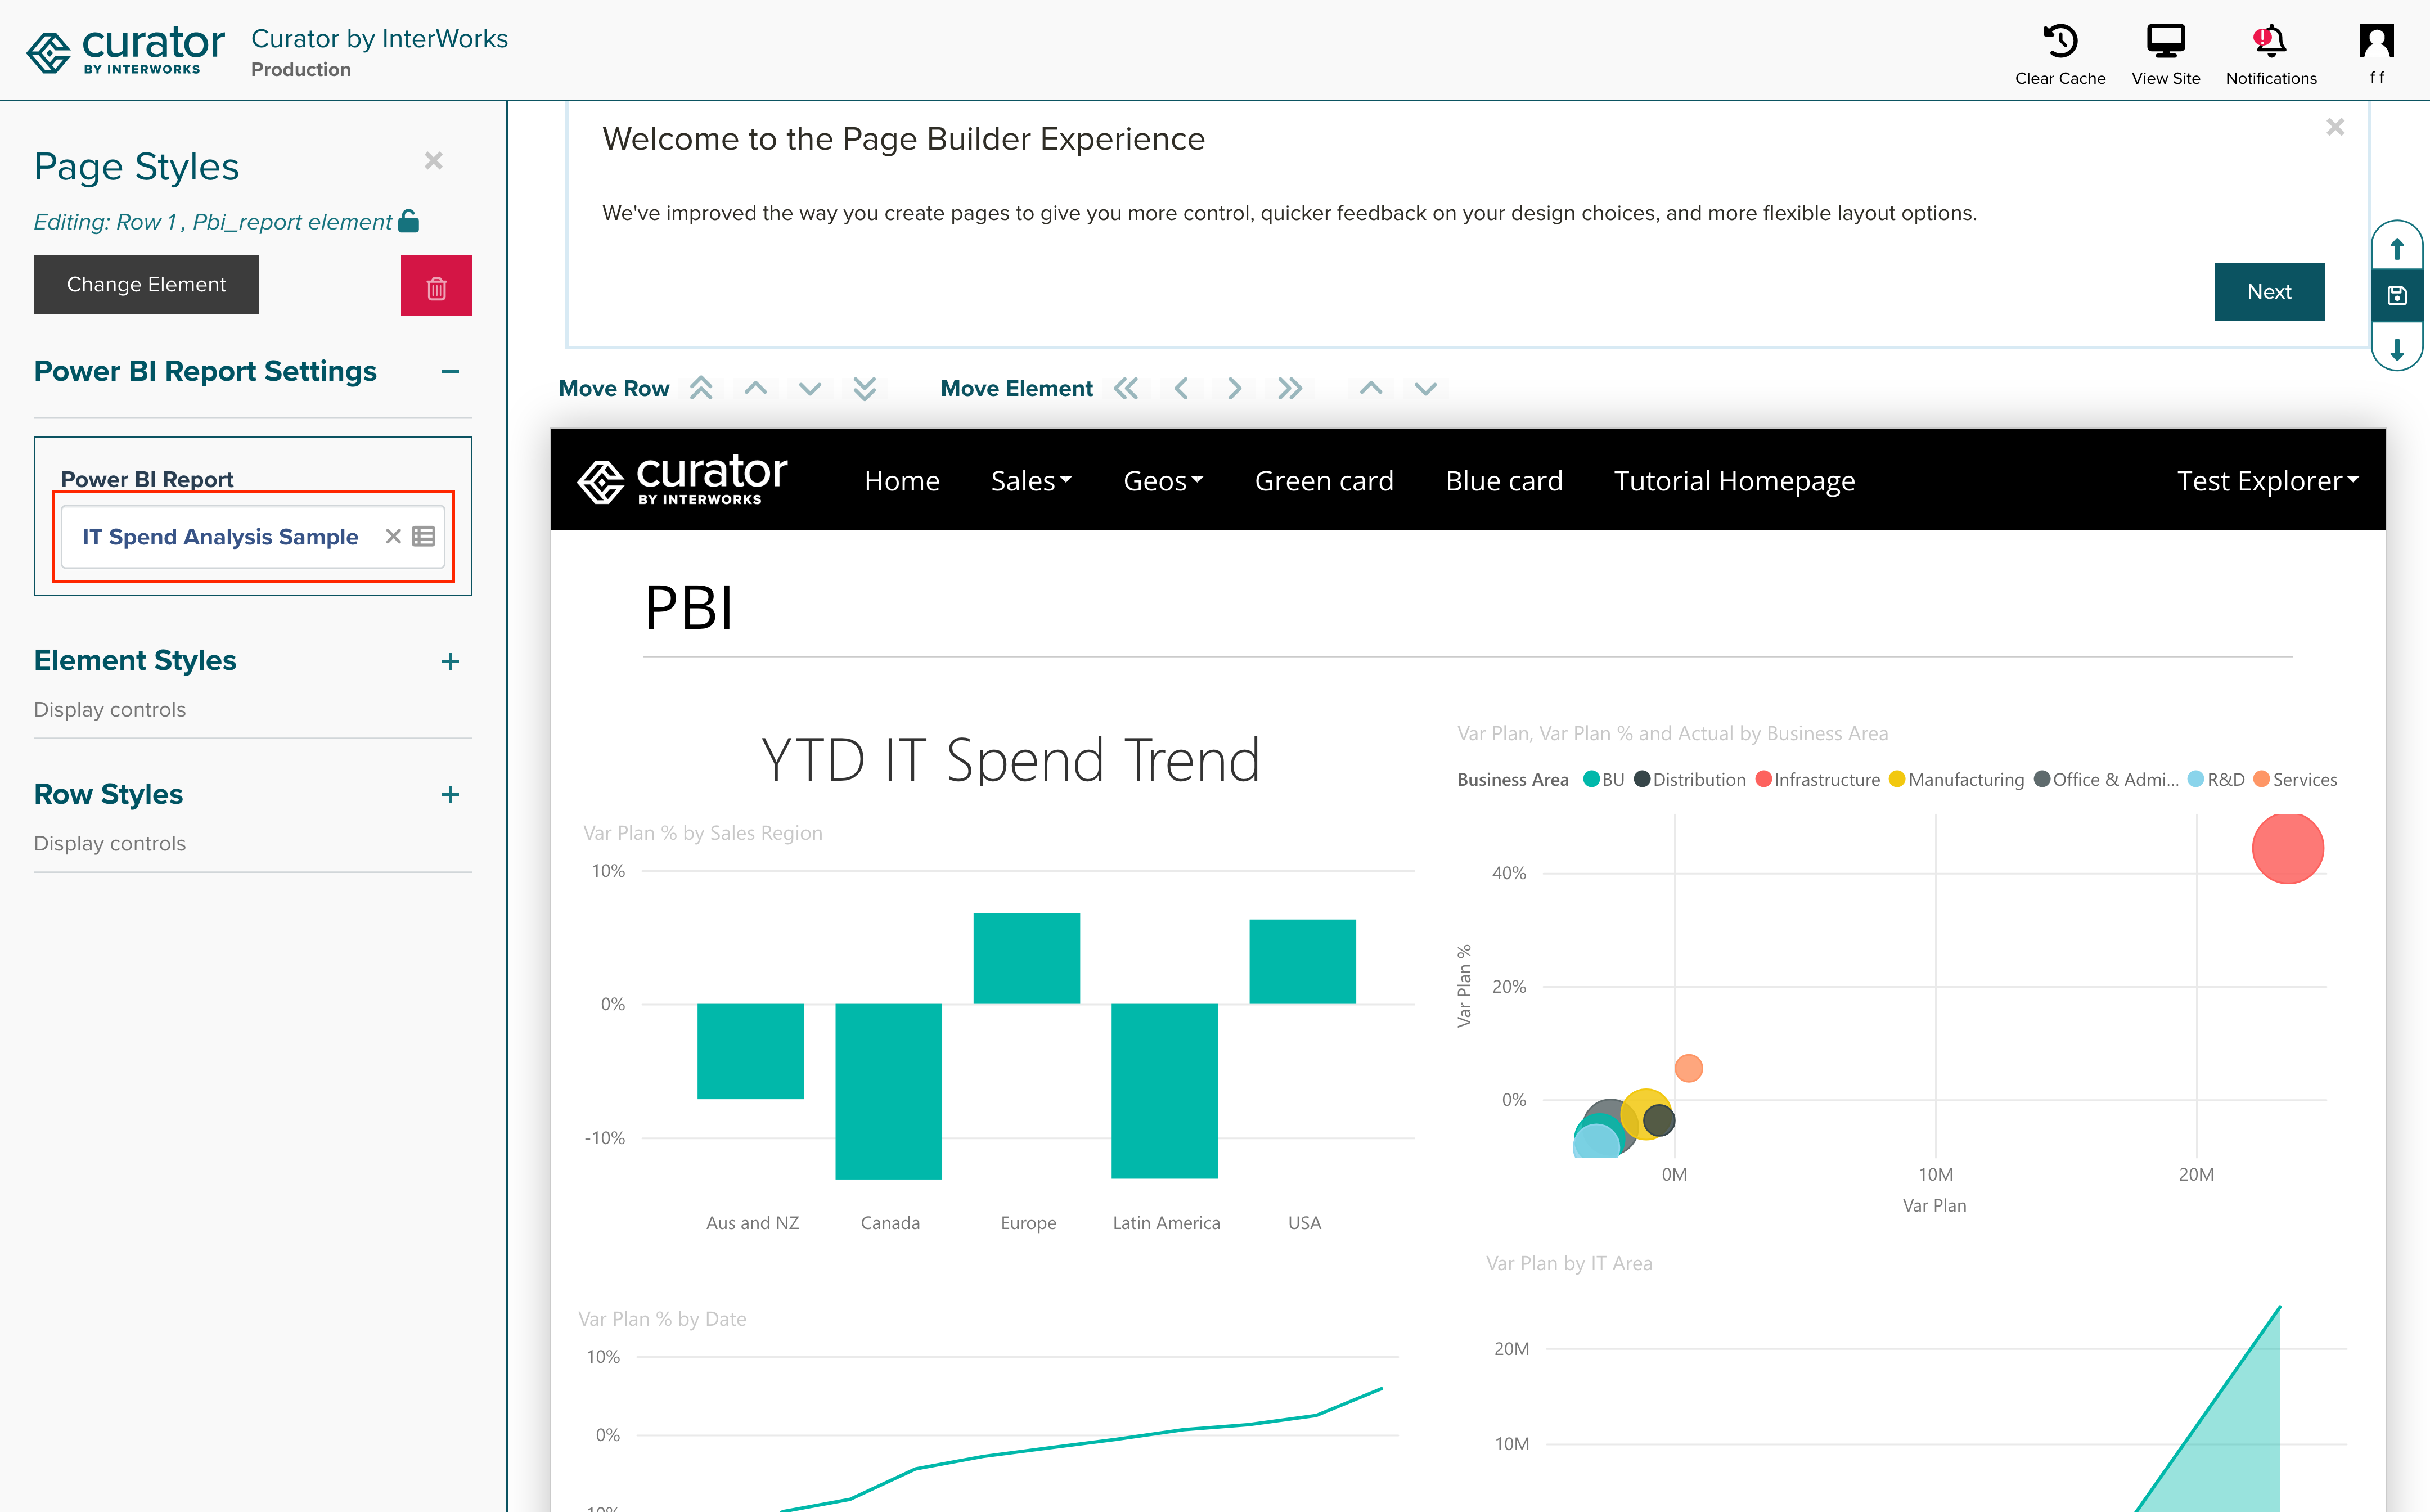
 5. In the Page Styles section on the left-hand side, you can choose the Report to Embed.
 6. Click **Save**.